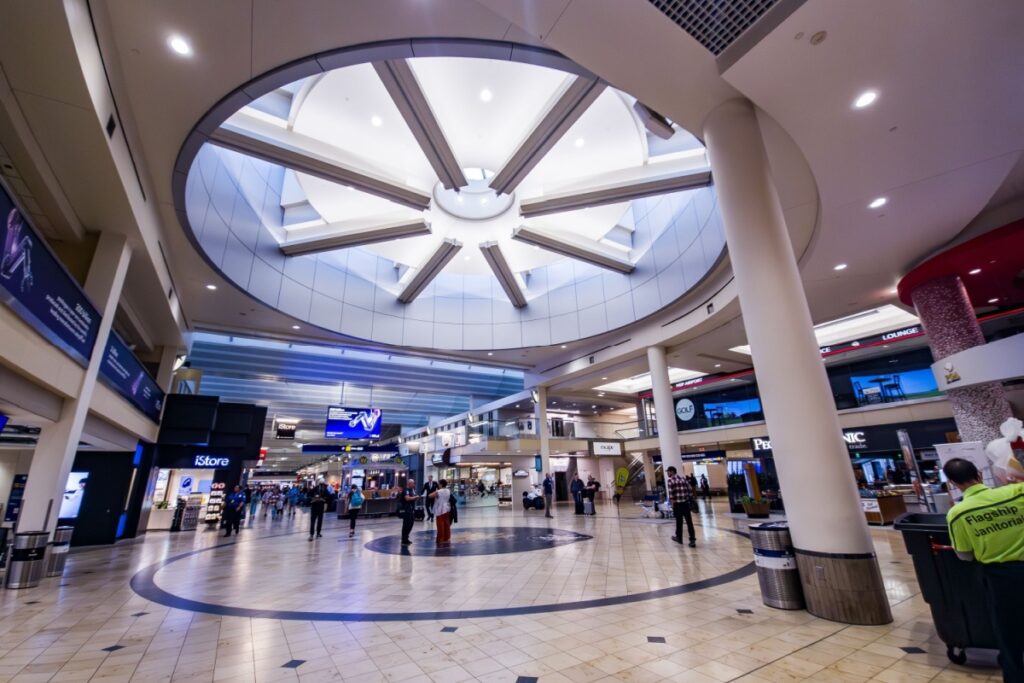
The 2025 North America Airport Satisfaction Study, conducted by J.D. Power, shows that traveler satisfaction across North American airports rose by an average of 10 points on a 1,000-point scale. The improvement is notable given the sustained high passenger volumes and ongoing flight delays. Gains were reported across all three airport categories—mega, large, and medium—driven mainly by enhanced food, beverage, and retail services, as well as smoother passenger movement through terminals.
Overall Increase in Passenger Evaluations
By category, the results show an increase of 8 points for mega airports, 15 points for large airports, and 10 points for medium-sized facilities. According to Michael Taylor, senior director of travel, hospitality, and retail at J.D. Power, the integration of local food and retail offerings has contributed to creating a “genuine sense of place” for travelers.
The study also highlighted a spending link: passengers who rated their experience as “perfect” spent an average of $42.39, which is $16.54 more than those who described their journey as merely “acceptable.”
Differences by Airport Size
The report defines mega airports as handling more than 33 million passengers annually, large airports between 10 million and 32.9 million, and medium airports between 4.5 million and 9.9 million.
Among mega airports, Minneapolis–Saint Paul International Airport ranked first with 660 points, followed by Detroit Metropolitan Wayne County at 649 and Phoenix Sky Harbor with 634. At the bottom of the category, Newark Liberty International Airport scored only 565 points.
In the large-airport category, John Wayne Airport (Orange County) led with 730 points, followed by Tampa International Airport at 709 and Dallas Love Field at 705. The Kansas City International Airport, which recently opened a new terminal, improved significantly to secure the fourth spot with 691 points.
For medium airports, Indianapolis International Airport retained the top position with 713 points, while Ontario International Airport followed closely with 709 and Buffalo Niagara International Airport reached 698.
Persistent Challenges in Passenger Experience
Despite the improvements, congestion and wait times remain major challenges in large-scale facilities. At mega airports, 23% of travelers reported spending 21 minutes or longer at security checkpoints, while 57% described the terminals as “moderately crowded.”
By contrast, medium and large airports performed better: between 50% and 56% of passengers passed through security in 10 minutes or less, with many characterizing the terminals as relatively uncrowded.
Even as annual passenger growth appears to be stabilizing, airports still face strong operational pressures to meet demand, including delays, bottlenecks, and elevated traveler expectations.
Methodology and Broader Significance
The 2025 study is based on 30,439 surveys conducted among U.S. and Canadian passengers between July 2024 and July 2025. It evaluates the airport experience across seven dimensions: ease of travel, trust in the airport, terminal facilities, staff interaction, departure and arrival process, food, beverage, and retail services, and the final stage of the journey.
Capital investments in new or upgraded infrastructure contributed significantly to higher passenger perceptions. In addition, airports that incorporated local elements—through food, retail, or cultural features—scored on average 190 points higher than those that did not.
The findings underscore that, while operational strains persist, many airports across North America have managed to reverse declining satisfaction trends and enhance their standing with travelers.


